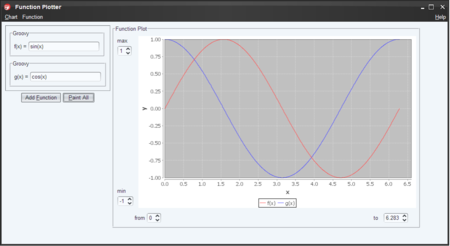
今回はすべてのグラフを描画する「paintAll」処理を実装します(一覧)。 マルチ MVC とは直接関係ありませんが・・・。
今回実装するのは以下のソース:
- FunctionPlotter/griffon-app/models/MonolineFunctionModel.groovy
- FunctionPlotter/src/main/functionplotter/FunctionDataFactory.groovy
- FunctionPlotter/griffon-app/views/FunctionPlotterView.groovy
- FunctionPlotter/griffon-app/charts/CoordinateChart.groovy
- FunctionPlotter/griffon-app/controllers/FunctionPlotterController.groovy
以下、順に見ていきましょう。
MonolineFunctionModel.groovy
MonolineFunctionModel クラスは、プロパティに関しては「はじめての幻獣 Griffon 研 (25) : マルチ MVC への道 (2) : MVC グループをコーディングする」で作成したものと同じです。 これに加えて、後で見る FunctionDataFactory クラスを作成するメソッドを新たに定義します:
package functionplotter

class MonolineFunctionModel{

    @Bindable String name
    @Bindable String function
    @Bindable int samples = 1000

    def createDataFactory(){
        return new FunctionDataFactory(name:name, function:function, samples:samples)
    }
}
FunctionDataFactory.groovy
FunctionDataFactory クラスは、MonolineFunctionModel クラスの持つ情報から JFreeChart でグラフ描画を行うのに必要な XYSeries オブジェクトを生成するクラスです。 処理自体はあまり複雑ではありませんが、コストのかかる処理を EDT 外で行うためにクラスとして抽出しています*1。
package functionplotter

import org.jfree.data.general.DatasetUtilities
import org.jfree.data.xy.XYSeries

class FunctionDataFactory{

    String name
    String function
    int samples

    XYSeries createXYSeries(double from, double to){
        def func = new ScriptFunction2D(this.function)
        return DatasetUtilities.sampleFunction2DToSeries(func, from, to, this.samples, this.name)
    }
}
- Function2D クラスについては「はじめての幻獣 Griffon 研 (15) : Charts プラグインでグラフを描画する (4) : Controller」を参照のこと。 このクラスも「FunctionPlotter/src/main/functionplotter」フォルダへ移しておきましょう。
FunctionPlotterView.groovy
FunctionPlotterView クラスに関しては、大きな変更点は前々回、前回にみた controlPanel, functionPanel の部分です(ただし、今回はその部分を省略)。 細かい点では migLayout() の使い方をチラホラ変えてます。
package functionplotter

JFrame.defaultLookAndFeelDecorated = true
JDialog.defaultLookAndFeelDecorated = true

actions{
    action(id:'paintAll',
        name: 'Paint All',
        closure: controller.paintAll,
        mnemonic: 'P',
        accelerator: 'ctrl P')

    ...    // その他のアクション
}

application(title: 'Function Plotter', location: [50,50], size: [1050,600],
               defaultCloseOperation:WindowConstants.EXIT_ON_CLOSE, ...){
    menuBar(){
        menu(mnemonic:'C', 'Chart'){
            menuItem action:paintAll
        }
        menu(mnemonic:'F', 'Function'){
            menuItem action:addFunction
        }
        glue()
        menu(mnemonic:'H', 'Help'){
            menuItem action:showLaf
            menuItem action:showInfo
        }
    }

    panel(border:emptyBorder(6)){
        migLayout()

        panel(id:'controlPanel', ...){ ... }    // 前回参照。

        panel(border:titledBorder(title:'Function Plot')){
           migLayout()

            panel{
                chart(id:'coordinate', CoordinateChart.class)
            }

            panel(constraints:'south'){
                migLayout(columnConstraints:'50[20][30]520[20][30]')
                domainSpinner('from', 0d)
                domainSpinner('to', Math.PI*2.0d)
            }

            panel(constraints:'west'){
                migLayout(layoutConstraints:'wrap 1',
                              columnConstraints:'[40]',
                              rowConstraints:'[15][15]320[15][15]')
                rangeSpinner('max', 1d)
                rangeSpinner('min', -1d)
            }
        }
    }
}

def domainSpinner(label, value){
    this.label(label)
    spinner(value:bind(target:model, label), stateChanged:controller.paintAll,
            model:spinnerNumberModel(value:value))
}

def rangeSpinner(label, value){
    this.label(label)
    spinner(value:bind(target:model, label), stateChanged:controller.adjustRange,
            model:spinnerNumberModel(value:value))
}
CoordinateChart.groovy
「Paint All」処理で複数のグラフを描画できるようにするので、チャートには凡例 (legend) を表示させるようにした方がいいでしょう。 この設定はグラフ生成を行うスクリプト CoordinateChart.groovy で行います。
package functionplotter

import org.jfree.chart.plot.PlotOrientation as PO

xylinechart(XAxisLabel: 'X', YAxisLabel: 'Y', orientation:PO.VERTICAL, legend:true) {

    xyplot {
        foregroundAlpha(1.0f)
    }
}
変更点は xylinechart ノードに「legend:true」を設定しただけです。
FunctionPlotterController.groovy
最後は、実際にグラフを描画する処理。 これはもちろん FunctionPlotterController に paintAll として実装します。
package functionplotter

import com.thecoderscorner.groovychart.chart.ChartBuilder
import org.jfree.data.xy.XYSeriesCollection

class FunctionPlotterController {

    def model
    def view

    private List functionModelList = []

    def paintAll = { evt = null ->
        def dataFactories = this.functionModelList.collect{ it.createDataFactory() }
        def props = model.copyProperties()

        doOutside{
            def ds = new XYSeriesCollection()
            dataFactories.each{ factory ->
                ds.addSeries(factory.createXYSeries(props.from, props.to))
            }

            def chart = createChart(CoordinateChart.class)

            chart.plot.with{
                dataset = ds
                rangeAxis.with{
                    lowerBound = props.min
                    upperBound = props.max
                }
            }

            doLater{
                view.coordinate.chart = chart
            }
        }
    }

    /** CoordinateChart.groovy (正確には CoordinateChart クラス) から JFreeChart オブジェクトを生成 */
    static createChart(Class chartScriptClass){
        def chartScript = chartScriptClass.newInstance()
        def builder = new ChartBuilder()
        chartScript.metaClass.methodMissing = { String name, args -> builder.invokeMethod(name, args) }
        return chartScript.run().chart
    }

    ...    // その他
}
- 基本的には上で定義した FunctionDataFactory と JFreeChart API を使ってるだけです。
- functionModelList は MonolineFunctionModel のリストです。 これは前回にも使ってましたが、「MonolineFunction」 MVC グループを生成した際にその Model をこのリストに格納するようにしてあります。 グラフ描画の際にこれらの Model から FunctionDataFactory オブジェクトを生成して使用します。
実行結果
上記の実装を行って「関数描画アプリケーション」を実行するとこんな感じになります(関数 g(x) = cos(x) を追加して描画):

ちょっと画像が小さいので見にくいですが。

- 作者: Andres Almiray,Danno Ferrin,James Shingler
- 出版社/メーカー: Manning Pubns Co
- 発売日: 2012/06/28
- メディア: ペーパーバック
- クリック: 8回
- この商品を含むブログ (19件) を見る