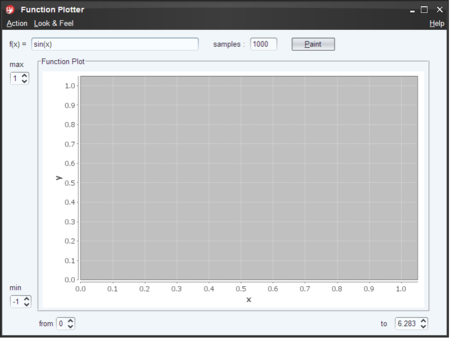
今回は View の変更(一覧)。 加える変更は次の通り:
- MigLayout によってレイアウト
- samples プロパティを入力するテキストフィールドを追加
- グラフを Charts プラグインによって実装
直接 Charts プラグインに関係あるのは最後のものだけなんですけどね。
MigLayout によってレイアウト
まずは全体のレイアウト。 大雑把な構成は同じです。
package functionplotter

import net.miginfocom.swing.MigLayout

JFrame.defaultLookAndFeelDecorated = true
JDialog.defaultLookAndFeelDecorated = true

actions{...}

application(title: 'Function Plotter', size: [800,600], ...){
    menuBar(){...}

    panel(border:BorderFactory.createEmptyBorder(6, 6, 6, 6), layout:new MigLayout()){

        panel(constraints:'north', ...){...}    // 関数(式)を入力する部分

        panel(...){...}    // チャートを表示する部分

        panel(constraints:'south', layout:new MigLayout('', '60[20][40]540[20][40]')){
            domainSpinner('from', 0d)
            domainSpinner('to', Math.PI*2d)
        }

        panel(constraints:'west', layout:new MigLayout('wrap 1', '[40]', '[10][20]350[10][20]')){
            rangeSpinner('max', 1d)
            rangeSpinner('min', -1d)
        }
    }
}

def domainSpinner(label, value){
    this.label(label)
    spinner(value:bind(target:model, label),
               stateChanged:controller.paintGraph,
               model:spinnerNumberModel(value:value))
}

def rangeSpinner(label, value){
    this.label(label)
    spinner(value:bind(target:model, label),
               stateChanged:controller.adjustRange,    // y 軸の調整
               model:spinnerNumberModel(value:value))
}
- 以前は MigLayout を各部のレイアウトにしか使用していませんでしたが、今回は全体のレイアウトにも MigLayout を使用。 constraints 属性に 'north', 'south', 'west' などを指定しています。 これらは BorderLayout と基本的には同じ*1
- x 軸と y 軸の変域を変更する処理をそれぞれ controller.paintGraph, controller.adjustRange と分けるので(実装は次回)、spinner コンポーネントを追加するメソッドを分けています(domainSpinner, rangeSpinner)
- south や west (後の north も)の内部のレイアウトは幅をハードコーディング(MigLayout のコンストラクタの引数)しているため、アプリケーションのフレームを最大化したりしてもレイアウトが変わりません。 これはちょっと柔軟性が欠如してるかな。 MigLayout 要勉強。
samples プロパティを入力するテキストフィールドを追加
次は、前回 Model に加えた samples プロパティを変更するテキストフィールドを追加します。 これは north パネルの「関数を入力するテキストフィールド」の後に追加しましょう:
application(...){
    menuBar(){...}

    panel(...){
        panel(constraints:'north', layout:new MigLayout('', '[30][300]25[50][50]25[50]')){
            label 'f(x) = '
            textField 'sin(x)', action: paint, columns: 30, text: bind(target: model, 'function')
            label 'samples : '
            textField '1000', action: paint, columns: 5, text: bind(target: model, 'samples', converter:{ it as int })
            button action:paint
        }
        ...
    }
}
このテキストフィールドの値は Model の samples プロパティにバインドしますが、テキストフィールドの値は String で、samples プロパティは int 型なので、値を変換する必要があります。 これを行うには converter 属性に変換のクロージャを渡します:
bind(target: model, 'samples', converter:{ it as int })
グラフを Charts プラグインによって実装
さて、やっと本題の Charts プラグインの使用。 まずはチャートを構築するスクリプトを生成しましょう:
griffon create-chart coordinate
このコマンドを実行すると以下のファイルが作成されます:
- FunctionPlotter/griffon-app/charts/functionplotter/CoordinateChart.groovy
このスクリプトには座標 (coordinate) だけを作らせることにし、関数のグラフ自体は描きません(Controller によって描画)。 よって dataset の構築はしません。 内容はこんな感じ:
package functionplotter

import org.jfree.chart.plot.PlotOrientation as PO

xylinechart(XAxisLabel: 'x', YAxisLabel: 'y', orientation:PO.VERTICAL) {

    xyplot {
        foregroundAlpha(1.0f)
    }
}
なんか、必要最低限の設定で素っ気ないですが・・・ チャートのデザインに関する設定を追加したい場合はこのスクリプトをいじりましょう。 で、このスクリプトで構築されたチャートを View に埋め込みます:
application(...){
    menuBar(){...}

    panel(..., layout:new MigLayout()){

        panel(constraints:'north'){...}

        panel(border:BorderFactory.createTitledBorder('Function Plot')){
            chart(id:'coordinate', CoordinateChart.class)    // チャートの埋め込み
        }

        panel(constraints:'south'){...}

        panel(constraints:'west'){...}
    }
}
- MigLayout で constraints 属性が指定されていない場合は center へ追加されます。
- 別スクリプトのチャートを埋め込むには、chart ノードにスクリプトの Class オブジェクトを渡すのでした。
- Controller からこのチャートを参照できるようにするため、id 属性も付加しておきます(id:'coordinate')
これらの変更を施した View はこんな感じになります:


Filthy Rich Clients アニメーションとグラフィカルエフェクトを使ったデスクトップJavaアプリケーション (The Java Series)
- 作者: チェット・ハーゼ,ロマン・ガイン,Chet Haase,Romain Guy,松田晃一,小沼千絵
- 出版社/メーカー: ピアソンエデュケーション
- 発売日: 2008/11/26
- メディア: 単行本(ソフトカバー)
- 購入: 2人 クリック: 42回
- この商品を含むブログ (20件) を見る
*1:ただし、MigLayout では 'south' や 'west' の追加順で少々レイアウトが変わります。